Periodicity of Radon Emissions
Society of Amateur Scientists
Los Angeles Chapter
H. Burwash
, J. Cascarano, D. Dolan and S. StaniferWe gratefully acknowledge the assistance provided by Stan Martins in the preparation of graphs used in this study and his willingness to share his skills and experience, so as to help us understand the phenomena witnessed here.
Introduction
A number of studies indicate that radon emissions occur from the earth. Some suggest that these emissions might serve as earthquake precursors (1-4). This study was undertaken to characterize the variability of radon emissions from the earth. Questions posed were: 1) are there "bursts" or abrupt increases of radon gas, 2) are these "bursts" random or periodic, 3) are these abrupt increases distinguishable from the continual release of radiation from the earth, 4) is the sensor selected for this study suitable for this purpose.
Methods
A twenty to twenty two inch hole with a six inch diameter was prepared in the ground. A RM-60 Microroentgen Radiation Monitor (Aware Electronics Corp; P.O. Box 4299; Wilmington, Delaware 19807) was placed in the hole. Because this sensor is sensitive to radiation from a variety of sources, we compared its response under a number of conditions to show that the radon signal was distinguishable from other sources of background radiation. The sensor was placed with the window facing down, six inches above the bottom . Data were collected on computer using Aware software.
Results
1) Factors influencing periodicity
After placing the radiation monitor in the twenty inch deep hole, it became
apparent that the emissions had a periodic nature (Fig. 1). Elevated levels of
emission appeared to occur on a regular basis, during the period 10/22-11/2/01.
The number of hours elapsing between these peak emissions was determined and
then averaged. The interval between peaks averaged 24hours and 20 minutes
duration over an 11 day time span (Table 1). The sensor was removed from the
hole on 11/14/01. Upon being returned to the hole the periodic nature of the
emissions was reestablished. Over the period of 11/14-11/19/01 the average
interval between peaks was 24 hours and 15 minutes (Table 1).
Figure 1.
Sensor in 20 inch deep hole
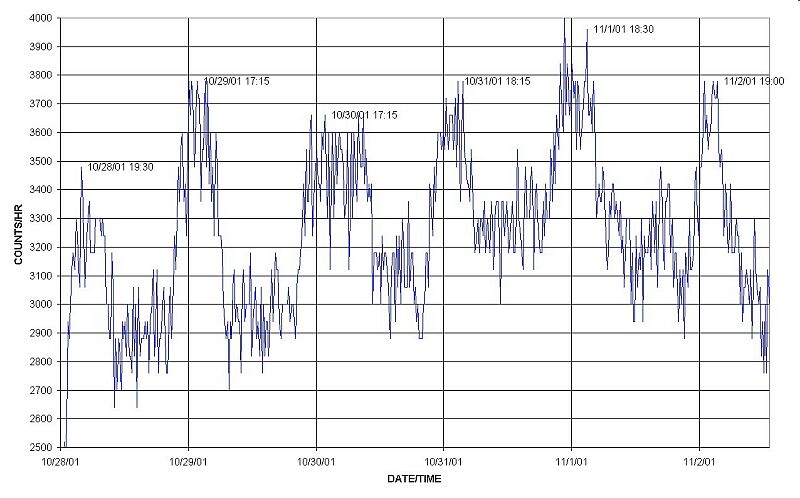
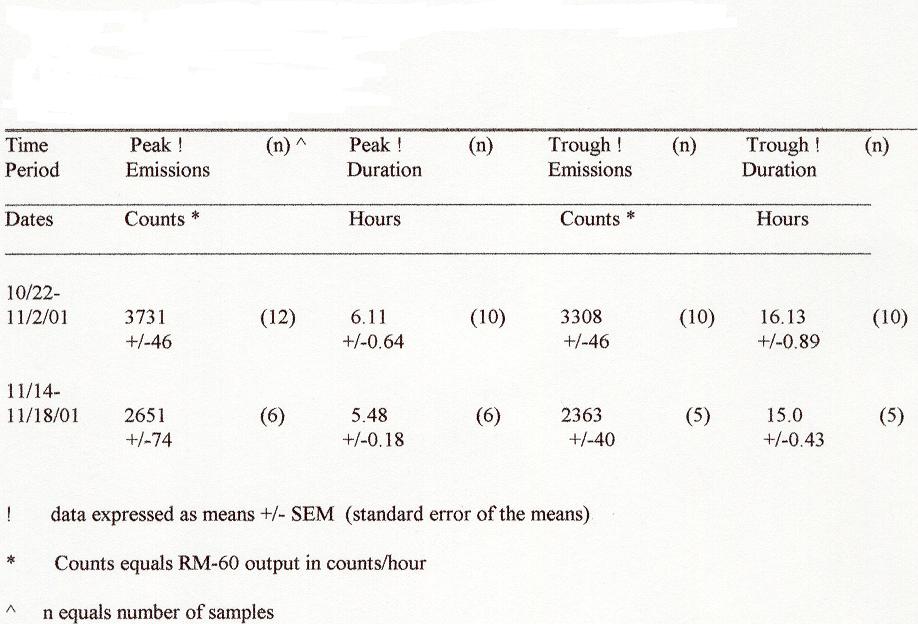
Table 1.
Periodicity of Radon Emissions from The Earth
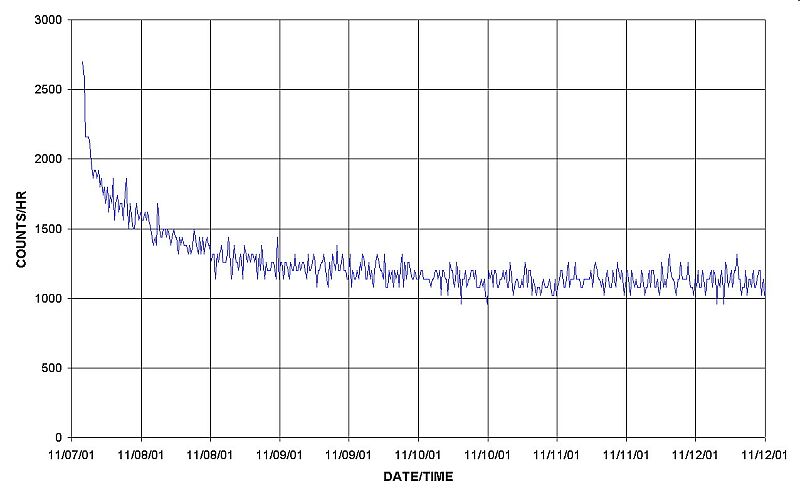
To determine if this periodicity was related to the positioning of the sensor in the hole or if a similar effect would be obtained if the sensor was positioned elsewhere, the sensor was suspended 5 feet above the ground in a small greenhouse close to the original hole. Counts diminished in amplitude to a very narrow band of 1100 to 1200 counts/hour (Fig. 2). No sign of periodicity was evident. Being in close proximity to the earth in the hole appeared to be necessary for recording this phenomenon.
Figure 2.
Sensor suspended five feet above ground inside greenhouse
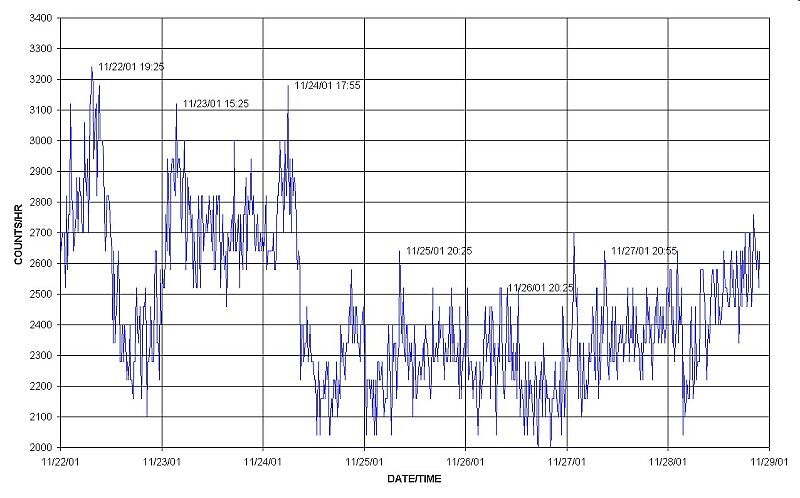
On November 24, one inch of rain fell between 8 am and 8 pm. No clearly defined sign of periodicity remained. Interestingly, the range in the amplitude of the counts/hour remained essentially the same even though the periodicity of the peak emissions was not evident (Fig. 3).
Figure 3
Sensor in 20 inch deep hole
One inch of rain fell 11/24/01
2) Characteristics of the Radon emission graphs
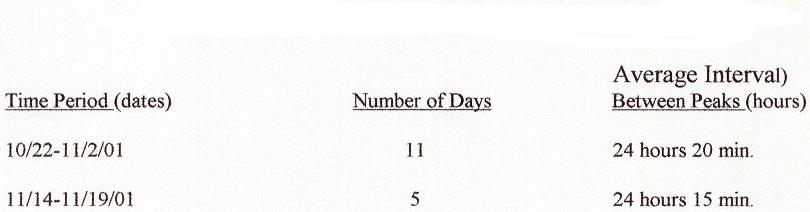
In examining peak and trough data of 10/22-11/2 (Table 2, Mean +/- SEM) the standard error of the mean indicates that peaks and troughs differ significantly from each other. The same is true for data from 11/14-11/19; the mean values of peaks and troughs are reliably different.
A second feature worth noting is the duration of peaks and troughs. Duration of the peak emissions (6.11 and 5.48 hours) is sharply different from the duration of the troughs (16.13 and 15.0 hours).
Table 2
Characteristics of Radon Emission Graphs
Summary and Conclusions
Radon emissions display a periodic cycle of 24 hour 20 min. Peak emissions last for approximately 6 hours followed by diminished emissions which last for approximately 16 hours. Such periodicity is not evident if the sensor is not in close proximity to soil gas emissions from the surface of the earth. The cyclic nature of the emissions is interrupted by rain. Because radon is a gas under standard temperature and pressure it diffuses rapidly when released into the atmosphere and its radiation signal is reduced as a function of distance from the soil. It is well known that water saturated soil restricts the exchange of gases between soils and the atmosphere. When soil gas is not released under these conditions, observed radiation counts are reduced. The fact that the radiation signal is 1) reduced during periods of heavy rain and when 2) the sensor is moved away from the soil, suggests that the periodicity we see in radiation counts is due to radon emissions from soils
References
1. Y. Yasuoka and M. Shi-nogi, Health Physics 72. No.5 pp759-761 (1997), Anomaly in Atmospheric radon Concentration: Possible Precursor to the 1995 Kobe, Japan, Earthquake
2. M. Al-Hilal and M. Mouty, Radon Monitoring for Earthquake Prediction on Al-Ghab fault of Syria. Nucl. Geophys Vol. 8, No. 3, pp291-299, 1994
3. A. Kies, J. Majerus, and N. D’oreye De Lantremange, Underground radon gas concentrations related to earth tides, Il Nuovo Cimento Vol 22 C. N.3-4, 1999
4. K. WattananIkorn, M. Kanaree and S. Wboolsake. Soil Gas Radon as an Earthquake Precursor: Some Considerations on Data Improvements. Radiation Measurements Vol. 20, No. 6 pp 593-598. 1998