60 kHz WWVB Solar Eclipse Radio Propagation Experiments
Conducted by John Magliacane, KD2BD
in 2017, 2023, and 2024
Introduction
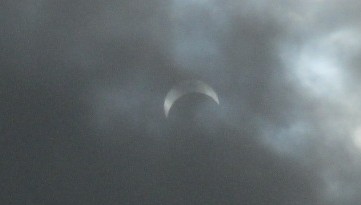
The solar eclipses that swept across the continental United States
in 2017, 2023, and 2024 provided unique opportunities to study the
effects the eclipse might have on radio signals propagating via the
Earth's ionosphere.
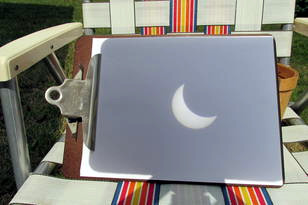
Three nearly identical propagation experiments were conducted by
John Magliacane, KD2BD on the east coast of central New Jersey
where relative changes in received signal amplitude and carrier
phase of NIST radio station WWVB were observed, recorded, and measured.
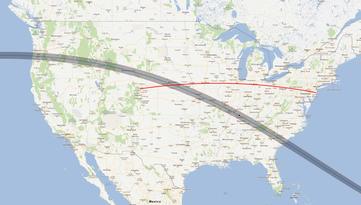
These changes were the result of the D-region of the Earth's
ionosphere reacting to the effects of the Moon's shadow passing
over the Great Circle RF path between WWVB and KD2BD. The D-region
is responsible for long-distance radio propagation in the low-frequency
(LF) radio spectrum, and is the region that reacts mostly quickly to
changes in solar radiation exposure.
Links
The following links provide detailed information
on each of these experiments:
References and Further Information
This page was last modified
on May 19, 2024.