| KB6MMS QRP and Simple Wire Antennas K1 Measured Performance on the 40 Meter Band |
|||
| Main My Station Kits Antennas Projects DX CW Logs Free Software |
40 Meter Band I don't use 40m too often. I have been successful on this band, but I don't care for the QRM. There is just alot of QRM at night around the QRP frequency of 7.040MHz. It is not bad during the day when I use 40m for local rag chews. I am pretty happy with the performance of the rig on 40m. Since I peaked the output power at 7.030MHz, at the upper part of the CW band the output power drops off. If I retune the rig to peak the power in the middle of the bands I can extend the bandwidth. Well I guess I can't have everything I want. It is a tradeoff and I chose to get the max power in the frequency range I use most. Here's the data.
|
||
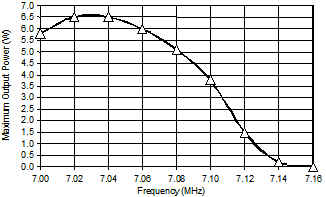
| Output Power I have included my test data for the maximum output power as a function of frequency from 7.000 MHz to 7.1600 MHz. The results show the drop variation in output power and the peak at about 7.035MHz. At 5.8W maximum output power, the K1 is above the manufacture's advertised spec of 5.0W. Actually, Elecraft says "Adjustable CW power output, nominally 0-5 watts or higher." I am content with this result. If I retune the rig to max the power at about 7.060MHz then I can extend the bandwidth with reasonable power. I perfer to max the power in the 7.030-7.040MHz range.
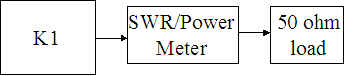
Configuration for this test
I conducted this test using my SWR meter/power meter manufactured by Diesel to monitor the power. I used my homebrew 50 ohm load. I know that the 50 ohm load is good because I measured the return loss to be better than 20dB to 60MHz. Just a quick note on measuring output power. I have seen some reports of output power and there is sometimes comparison between output power into a 50ohm load and output power into an antenna. The two measured output powers are usually different and often the result into the antenna is higher. Now, I will give my two cents on this. The measurement into the antenna is really the wrong way to do it, unless your antenna has extremely good SWR. This is due to the fact that poor, or even pretty good SWR, will cause a larger voltage (voltage standing wave, hence VSWR) to be present at various points on the transmission line up to the antenna. This includes the coax between the rig and swr meter and everything up to the antenna. Since most, if not all, swr meters measure a voltage, any increase due to SWR issues will cause a false reading. Therefore, it is always best to measure output power into a know good 50 ohm load. OK that is my two cents on this issue.
|
|||
Maximum Tuning Range The K1 is advertised to cover "up to 150Kz" My measured results are below. As you can see the tuning range is well over the 150KHz soft spec. This is another good result. Minimum Frequency = 6.9970 MHz
|
|||
| RIT tuning Range I measured the RIT tuning range. I know this is not a real big issue for some. However, I do know that some DX stations like to work offset TX/RX. This is when a wide RIT can be helpful. Also, sometimes you get a contact where the other guy is off frequency by 1-2 KHz or more. This is very rare in my experience, but still happens. Anyway the results are below. The RIT range is about +/-4KHz. This is typical for all four bands. Minimum Frequency = 7.0161 MHz RIT Lower Range = 3.9 KHz
|
|||
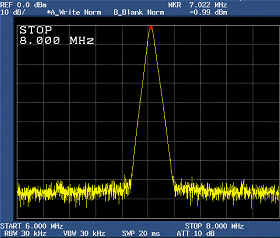
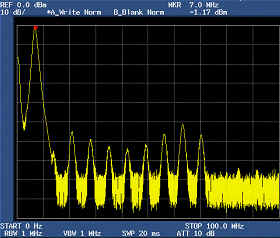
| Spectral Purity The spectral purity of the transmitted signal was measured. Though it may come as a surprise to some, when your transmitter is tuned to, let's say, 7.040 MHz and you transmit, you will generate a signal at 7.040MHz plus other spurious and harmonic signals at other frequencies. Those spurious signals are not desired and in fact the level (or power level) of those undesired signals is controlled by FCC regulations. This spectral purity test directly measures the output from the transmitter over a very broad frequency range so that one can immediately see what is actually being transmitted. For instance, if you set your transmitter to 7.040MHz again and key it, it is likely that you will radiate some level of power at the harmonics. Those harmonics are at 14.080, 21.120, 28.160 MHz and so on. In addition, you may also be transmitting at other frequencies which are generated in the mixer stages, amplifiers and other non-linear elements in the transmitter. The frequency of those components is determined by several factors one of them is the IF frequency. These undesired signals are often called spurs which is short for spurious. The tests on the K1 were conducted using an Advantest R3273 Spectrum Analyzer with a bandwidth of 100Hz to 26.5 GHz. I know that that is way over the top as far as bandwidth overkill, but it was what I had available. I had 48.2dB of attenuation between the K1 and the Advantest.
|
|||