Low pressure moved from the Ohio Valley into Upstate New York. A secondary low pressure center formed along the New Jersey coast. This second storm rapidly intensified as it moved northeast to a position just southeast of Nantucket.
At first glance, this may look like rain with embedded thunderstorms. But actually, it is an area of rain only along the Massachusetts and Rhode Island coasts. Over the remainder of the area it is snow. On this color scale, snow usually falls in intensities that show up as blue, or green. Once in a while, an area of yellow will show suggesting very heavy snow. In this picture...not only are there large areas of yellow, but even a line of red north of Worcester MA. This suggests areas of very heavy snow.
In fact, Ayer MA in northwest Middlesex County reported a total of 21 inches accumulation from this storm, including 8 inches of snow in one hour. Nashua NH reported 20.5 inches. Chelmsford MA reported 20.1 inches, including 6 inches in one hour. and Worcester MA reported 18 inches.
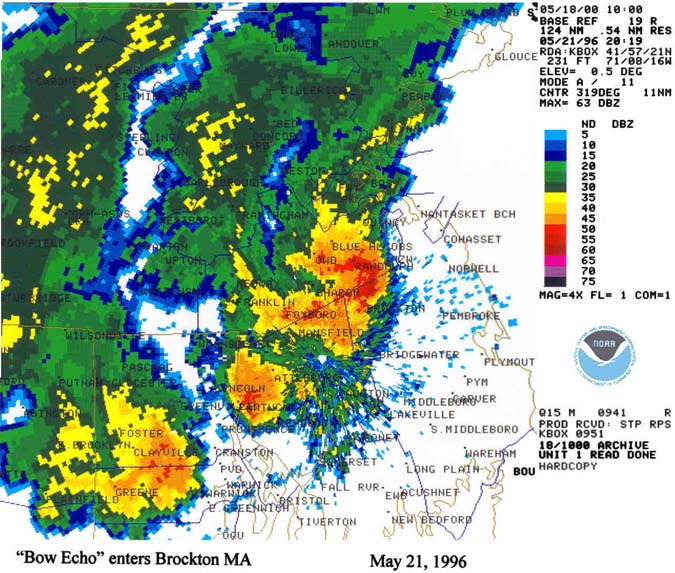
Brockton.jpg Bow Echo enters Brockton MA on May 21 1996
A strong cold front moved across the region during the mid to late afternoon of May 21st, producing strong thunderstorms and numerous reports of damaging winds. A downburst occurred in the Brockton MA area, producing winds estimated at 70 to 100 mph and causing extensive damage. A Severe Thunderstorm Watch was issued for all of southern New England; subsequently, Severe Thunderstorm Warnings were issued for Hartford, Tolland, and Windham Counties in northern Connecticut, and for Hampden, southern Worcester, Plymouth, and Barnstable Counties in Massachusetts.
In the image, note the "horseshoe" pattern of the line of thunderstorms south of Boston. Dry air is being drawn into the rear of this storm. The evaporation and cooling caused as this dry air entered the storm resulted in the downburst that moved through the Brockton area. Also note the thin line from Middleboro MA to East Greenwich RI; this is the leading edge of the cool air outflow from these thunderstorms.
Floyd.jpg Tropical Storm (formerly Hurricane) Floyd comes ashore Sept. 16, 1999
Hurricane Floyd generated a lot of headlines as it approached the United States in September 1999. The storm turned north and moved ashore in North Carolina; it then moved back over the coastal waters as it moved up the coast on September 16. Around 8 o'clock in the evening, Floyd moved ashore at Long Island, NY, just east of Kennedy Airport. The storm then moved northeast across eastern Connecticut and northeast Massachusetts.
One of the Realities of New England hurricanes is that most of the heavy rain occurs along and to the left of the storm track. Note where most of the rain is located in this image. It is along and west of the path the storm eventually followed. Note also that there is very little rainfall to the east and south of the storm.
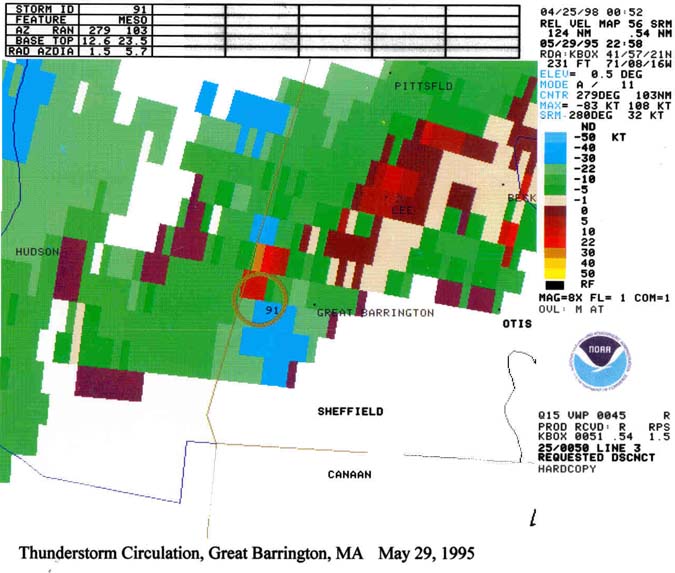
Grtbarrtn.jpg Doppler Velocity Image, Thunderstorm Circulation, Great Barrington MA May 29, 1995
A line of thunderstorms moved from New York into western New England. One thunderstorm moving out of Columbia County NY into southern Berkshire County MA produced a tornado as it approached the town of Great Barrington MA. This tornado destroyed the fairgrounds and killed 3 people trapped in an automobile. The tornado remained on the ground for 18 minutes, lifting off the ground near Sandisfield, MA, near the Hampden County line.
This image is an example of how Doppler Radar displays not just where the storms are, but also the motion within the storms. In the picture the WFO Taunton radar is off the picture to the right. Red is motion away from the radar, while green and blue are motion toward the radar. The is one spot, which the radar computer has flagged, where there are red and blue readings directly next to one another. If the red is "to the right of the radial" from the radar, then this shows a counterclockwise circulation. What you are seeing in this image is not the tornado, but rather the parent circulation that would, within 8 minutes, give birth to the Great Barrington tornado.
Leverett.jpg "Training" Thunderstorms in Franklin County MA June 13, 1996
Showers and thunderstorms developed during the afternoon along a weak cold front that moved slowly east across the area. Wind damage was reported in several locations across central and western Massachusetts. One-inch hail was reported in the town of Leverett MA (Franklin County). In addition, thunderstorms traveling along an identical path over a short period of time (or "training") produced very heavy rainfall and flash flooding in parts of western Massachusetts. The Sawmill River in Leverett saw the worst flooding in 100 years. Rainfall was measured at 3.19 inches in Greenfield MA, 2.85 inches at Amherst MA, and 1.29 at Sunderland MA.
In the image, note the large area of red southeast of Greenfield MA. This thunderstorm is producing hail and heavy rain over Leverett. Meanwhile, the two small red cells northwest and south-southeast of Northampton would, within 30 minutes, travel over Leverett as well.
Malden.jpg Smoke Plume from Malden Mills fire December 12, 1995
This image shows how sensitive the Doppler Radar can be. The radar is in "clear air mode", taking twice as long to do a complete scan of the atmosphere as it does in "precipitation mode". It is clearly detecting the plume of smoke particles, with the strongest concentration near Lawrence MA and lesser concentration of particles downwind to the southeast.
Oceffect.jpg Ocean effect snow over Nantucket January 18, 1997
Very cold west winds moving over the warmer ocean water created a band of snow showers that grazed Marthas Vineyard and moved directly across Nantucket MA. This is similar to the "lake effect snows" that occur to the lee of the Great Lakes each winter. Amounts from such snow bands can vary greatly over the space of a few miles. Nantucket reported a total accumulation of 8 inches. Tisbury (on Marthas Vineyard) received 3 inches, Vineyard haven 1.5 inches, and Edgartown 0.8 inches.
As a bonus, note the thin line extending from Taunton toward the southeast. This is how sunrise appears on the radar. The steady stream of energy from the sun is interpreted by the radar as precipitation all along that particular radial. Sunset looks similar, but to the west. The location and time of occurrence changes with time of year as does the location of sunrise and sunset.
Noreaster.jpg Heavy prolonged rainfall in Northeast Massachusetts - October 19-21, 1996
An extremely prolonged Noreaster pounded southern New England with very heavy rainfall and strong winds. Winds gusted as high as 81 mph over coastal Rhode Island with gusts of 50 to 60 mph common in all coastal areas. Rainfall totals of 6 to 12 inches fell in eastern Massachusetts and southern New Hampshire with 2 to 5 inches elsewhere. Some totals include Newburyport MA 13.03 inches, Bedford MA 11.21 inches, East Woburn 10.75 inches, Groveland MA 10.10 inches, Rockport MA 9.68 inches, Boston (Logan Airport) 7.92 inches.
This image is an estimate made by the radar as to how much rain fell. It is based on the total amount of energy reflected back to the radar; it uses equations based on comparisons of past rainfall with observed radar reflectivity. Note the two maxima of rainfall...one near Boston and the second in western Connecticut. The storm drew on moisture from a tropical system well offshore; this enhanced the amount of moisture available for rain. For a while, this moisture was fed up across Long Island into western Connecticut. When the storm shifted, the winds drawing on the moisture also shifted and refocused the area of maximum rainfall in northeast Massachusetts.
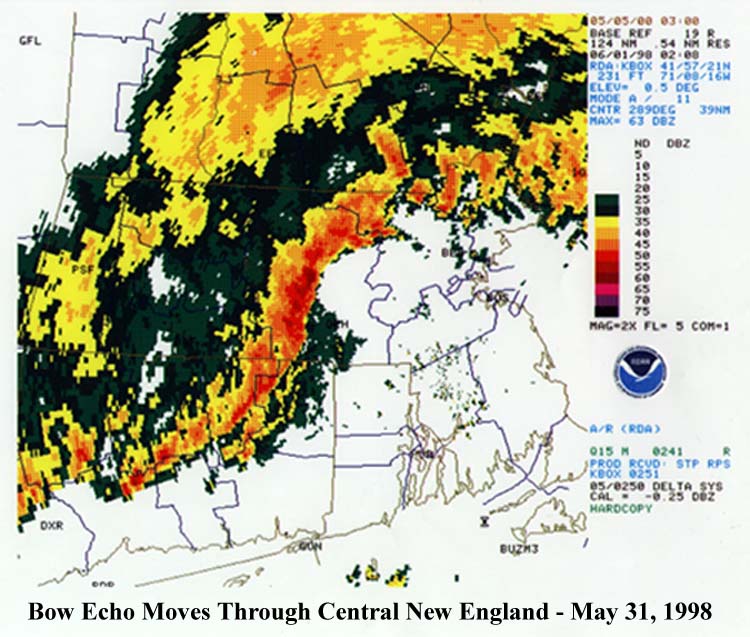
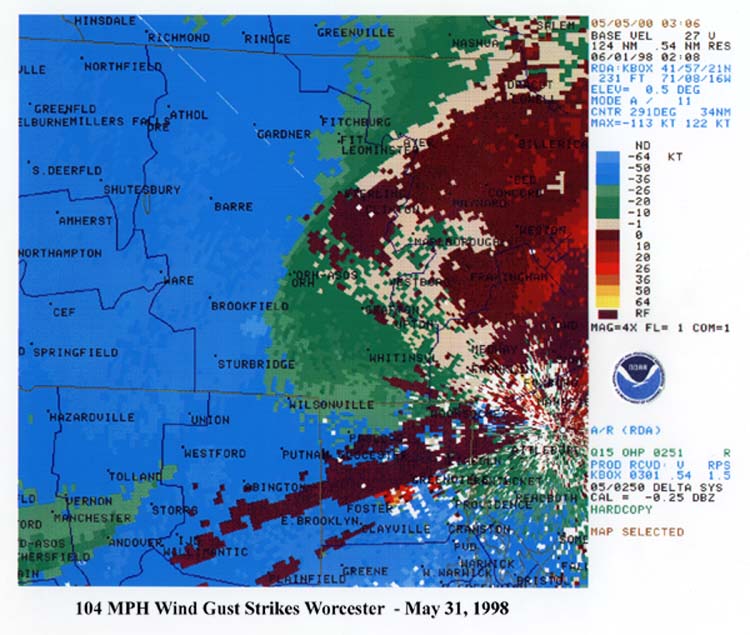
Worcref.jpg Worcvel.jpg Squall Line of Thunderstorms moves through Central New England May 31, 1998
A powerful cold front combined with a warm and humid air mass to produce widespread severe weather across southern New England. Wind damage and large hail were common and there was a tornado in northern Hillsborough County NH near Antrim.
The image worcref.jpg shows the radar reflectivity image as a squall line becomes severe. The line has evolved from a straight line into a bow-shaped line. This comes about as outflow from one storm races ahead of the outflow from the adjoining storms.
The image worcvel.jpg shows the radar's velocity measurements from the same time. The fastest motion is located near the head of the bow, which is near Worcester. A wind gust to 104 mph was measured from this squall line at Worcester.