| WeatherView and Peet Bros. Instrument Screen Shots: |
| Main Peet Display Device: |
| Peet Outside Instruments: |
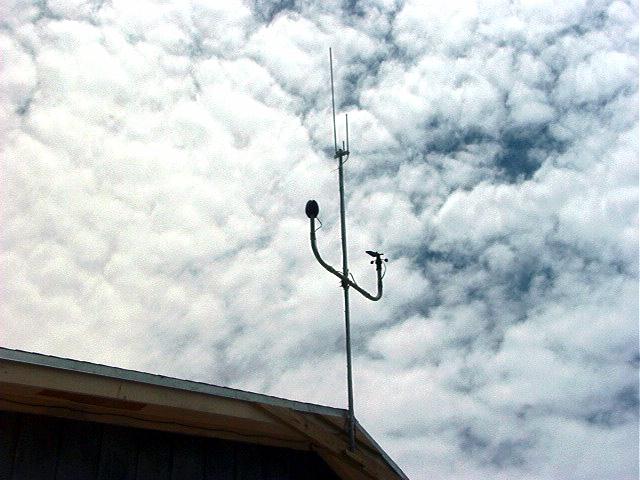
OK, the weather in the Fla. Keys isn't always great. Picture also includes my 2 meter and 70 cm antenna, but who's counting?
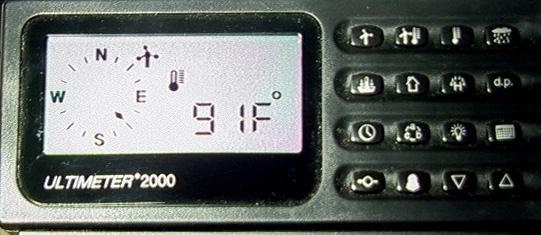
| Peet Weather Picture: |
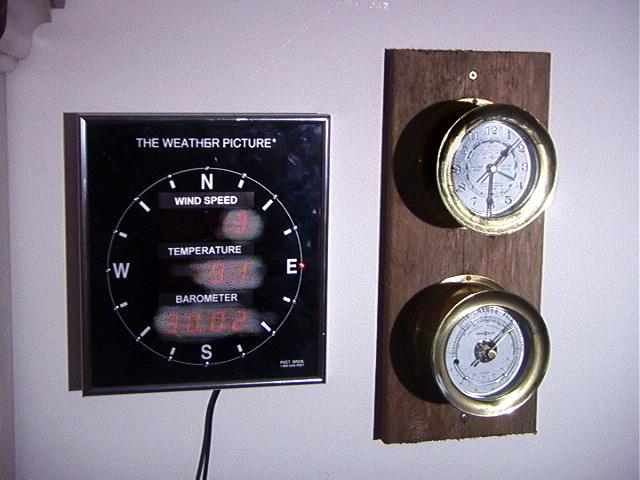
Note I believe in old fashioned analog instruments too. I had to burn in the LED readings, hence the blur, but at least they can be seen, thanks to Photoshop.
| My Program to read the Peet Device: |
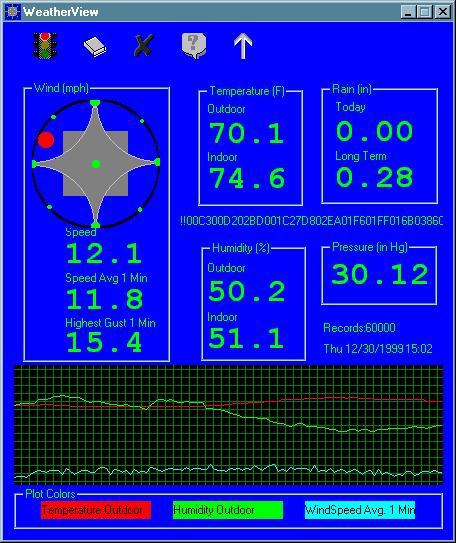
This is the version of the program compiled in Debug mode. On this version, you get a button (the arrow) to allow you to read in test data, and the raw data is displayed on the screen. The previous page showed the screen in Release mode. This is test data, the month, day and time is correct, but the year was 1997. The Peet instrument tells only the day of the year, the year comes from the PC. So if you run old test data you get the current year. The buttons at the top have balloon help, change appearance when the mouse hovers over them, and do the following:
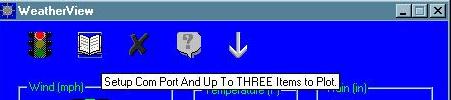
| Showing the balloon help and the changed Options button when mouse is over it: |
| Options Dialog: |
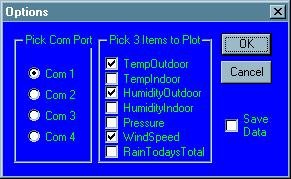
The user can choose which three measurements to plot, also whether to save data for import into Excel.
| About Dialog: |
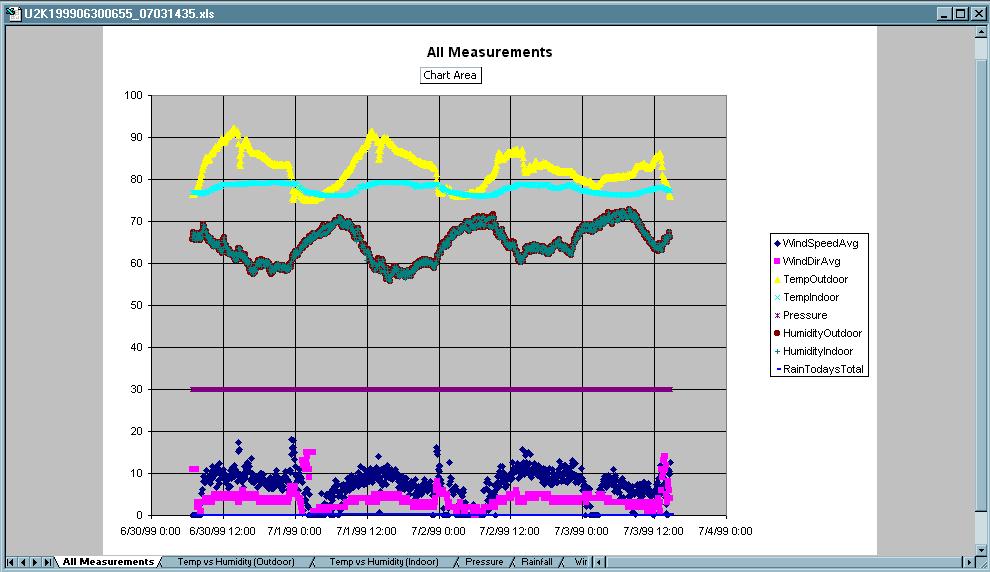
| Plotting saved data using Microsoft Excel: |
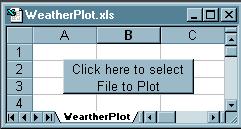
I have included an Excel spreadsheet in the Zip named WeatherPlot.xls that looks like above. Put it in the same folder as your output data (unless you moved it, the folder is below where you put WeatherView.exe and is named "OutputData"). Double click WeatherPlot.xls, and after answering "Enable Macros" to the Macros question, click the button shown above, then select the filename you want to plot from the resulting dialog. One of the six plots is shown below. If you notice the tabs at the bottom of the plot, the one shown is All Measurements. You can also see Wind Info, Temp and Humidity for both indoor and outdoor, Barometric Pressure, Rain, and the raw data. The scaling on individual plots is better than on the All Measurements plot, making analysis easier. The data files are saved one per day, in the filename format: U2Kyyyymmddhhmm.txt, but can be manually merged together to plot as large a range as desired (remove the duplicate headers from the merged file). Below is four days of data merged together. I have another version of the program that puts the output into a Microsoft Access database. If there is any interesl, Email me and let me know and I'll send it to you. Plotting is less sophisticated with the Access version.
| One of Seven Outputs From Above: |