On this page I hope to show some images I have received from the NOAA series of polar orbiting satellites.  My work colleague, John Boyer,  got me fascinated with this subject within weeks of sharing an office with him.
These days, receiving such images is a lot easier than you might think.  Go to the Remote Imaging Group (RIG) website to find out how.

The images shown here were received in the summer of 1999 using a very cheap 'scanner' (Realistic PRO27, ten pounds second hand)  fed from an amateur radio antenna in the loft pointing in the general direction of 'upwards'.

The audio from the receiver was fed into the sound card of a computer and decoded using 'Wxsat' software available free from the internet.

The NOAA satellites orbit the earth once every 90 minutes or so.  However, because of the rotation of the earth, there are only a couple of passes per day when a particular satellite will appear above the horizon and can be received.  The times of the passes are published in the RIG quarterly journal or can be calculated using satellite prediction software available free from the internet. Since these predictions are based on the known laws of physics they are extremely accurate.

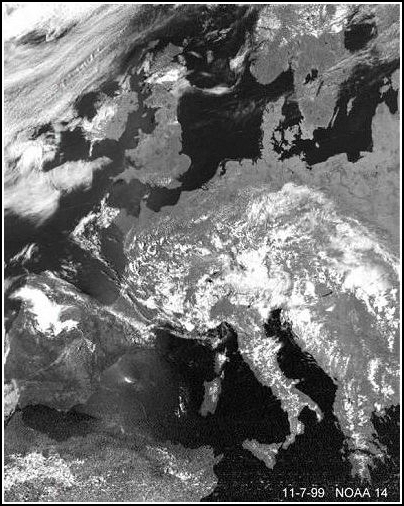
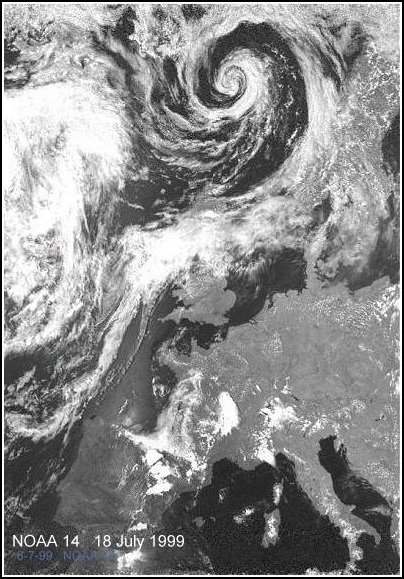
Here in the UK a 'high pass', ie one in which the satellite passes virtually overhead, can image the earth from North Africa in the south to Greenland in the north taking in the whole of Europe. With such a pass the satellite would take about 15 minutes to travel from one horizon to the other.  On the other hand, a low pass to the east of only a few degrees may only last a minute or two but could image the area around the Caspian Sea and parts of Russia and the UK may not even feature.
A satellite can pass from either North-to-South or South-to-North. This is because, within its fixed orbit around the earth, the earth is also rotating.  If you can't visualize this then try modeling it with everyday spherical objects - apples, oranges, footballs and peas usually work !
Thanks to today's technology, for the price of a theatre ticket I was able to set myself up to receive images like these. If, like most people these days,  you have a PC with a sound card and you have the ability to resist the claims from your partner that a theatre ticket is far better value for money, then anyone can do the same.

Once you have got some really good satellite pictures, and I suggest not before, then click HERE to see some pictures taken from space with the resolution that will enable you to count the number of pods on the 'London Eye'.
If, after seeing these, you think that your images are a bit pathetic, bear in mind that to obtain these images it cost some government a great deal more than a theatre ticket.  Anyway, who wants to know the number of pods on the London Eye as seen from a space satellite.  That would be somewhat sad.   Much more fun to go there and count them for yourself !
The best images are usually obtained when there is plenty of sunlight, as would be the case with a mid-day pass on a glorious summer day.  However, other times of the year can yield interesting images featuring areas of snow cover and thunderstorms.
The NOAA series of satellites not only transmit pictures in the visual spectrum (ie. as seen by a person lucky enough to be on board) but also infra red images showing the varying amount of heat reflected from the earth's surface and cloud cover.

The images below show both the visual and infra red pictures transmitted by NOAA14 over the UK on the 18th June 2000 during the same pass.
This is the visual image.
This is the infra red image
Britain and part of Europe as we would see it riding aboard NOAA14.  Note the shadows of the clouds on the earth's surface and the glint of the sun reflected off the sea near the coast of Holland. Major cities and large towns can be seen as dark blotches.  Rooftops reflect less light than the green open countryside.
This corresponding infra red image taken at the same time shows up the warmer land masses as dark areas against the lighter, colder sea. Again the warmer major cities show up as darker blotches.  Note that the Channel Islands can be seen more clearly and the sun's glint no longer features.
This image is from an easterly low angle pass of NOAA 14.  The maximum elevation of the satellite was about 15 degrees enabling it to capture both the UK and most of the Black Sea.

I have tried to emphasize the mid-tones to show the land masses more clearly (with a resulting loss of detail in the clouds).

London and Paris can be clearly seen as can many Greek islands and the river Dnepr to the north of the Black Sea.

After receiving this mid-summer, mid-day image I went back into the garden and looked up at the cloudless deep blue sky, safe in the knowledge that I wasn't on holiday in the Lake District or, even worse, Italy.
Graphics : Dundee University
The diagrams below show the part of the earth imaged by typical westerly, overhead and easterly passes.  All three passes would be receivable in the UK but, as can be seen, only one would result in an image in which the UK featured.
In practice, with modest receiving equipment, the easterly and westerly passes would result in shorter 'strips' of the earth being imaged since the satellite is much lower in the sky and its signal is available for a much shorter time.
     
 
Neale's  Weather  Page