PM8307 — A Simple RF–Power Meter Using the Logarithmic Amplifier AD8307
The idea and circuit for this power meter go back to a publication of
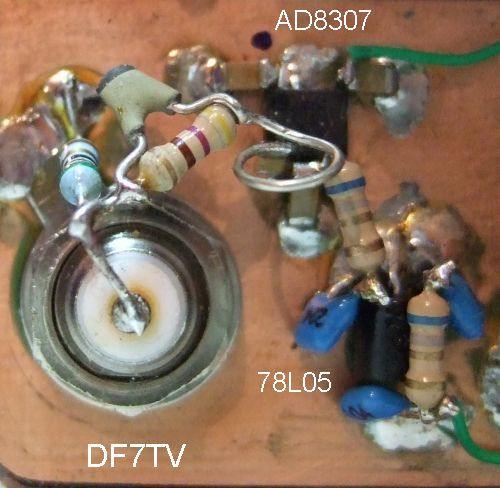
Wes Hayward[1]. Having the surface mount version of Analog Devices AD8307,
I have changed some parts (capacitors) to SMD, which better fit to the SO-8 case.
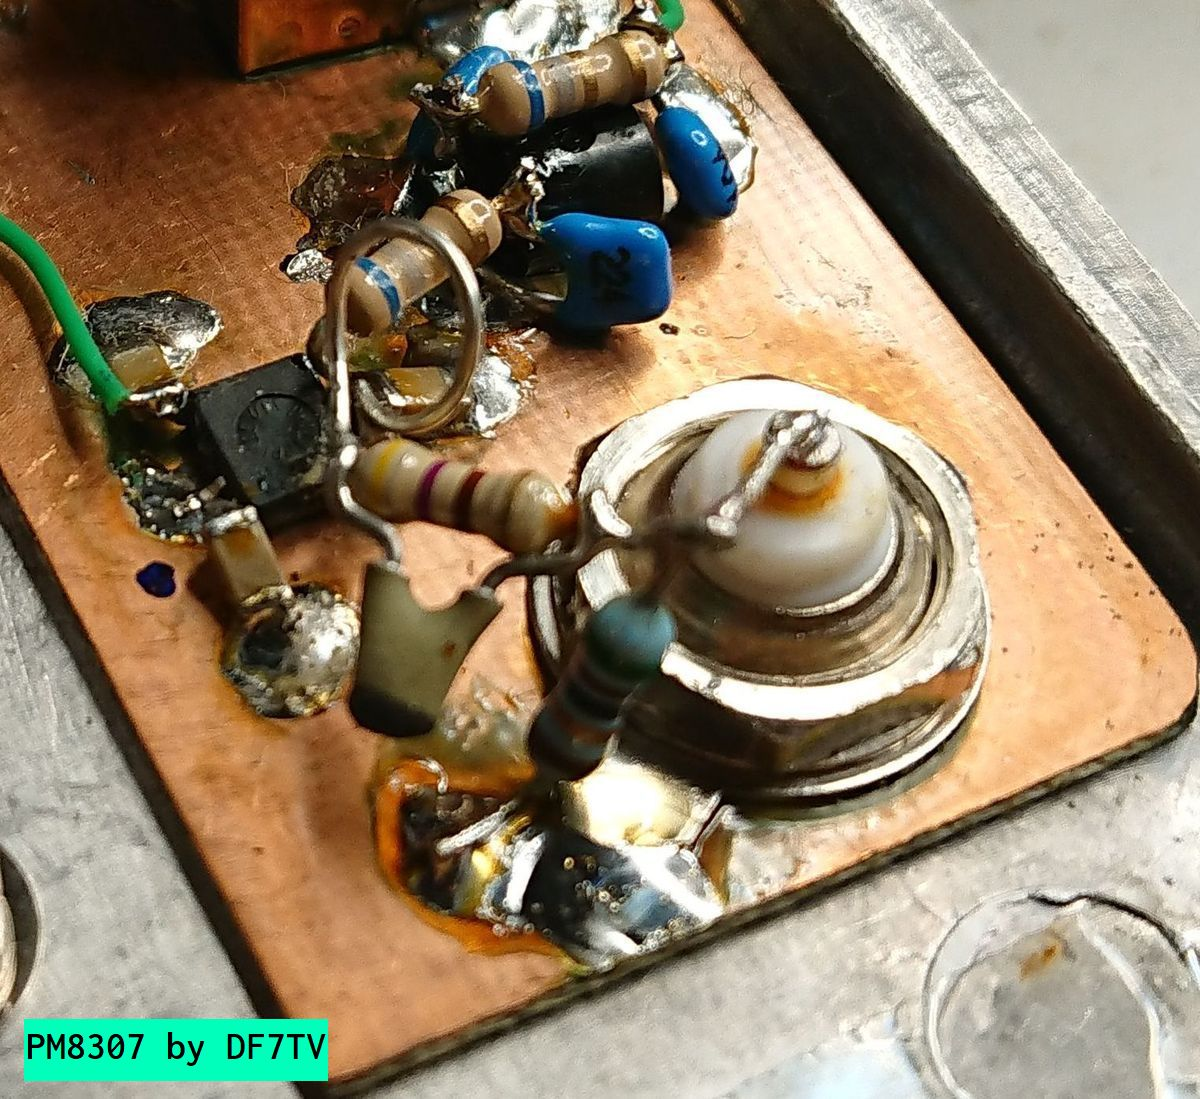
The input and output designators of the voltage regulator, U2 = 78L05, in the published circuit (Fig. 1 of the article) are not shown correctly (they are reversed). The input pin of U2 has to be connected to R8/C7, the output pin to R3/C6.
Apart from that, the circuit used is very similar to the one published.
The gain of the noninverting amplifier is set to G = 2 to get an output signal of about 50 mV/dB which may be displayed by an external DVM or scope.
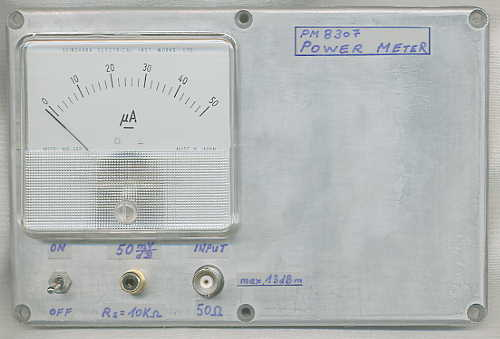
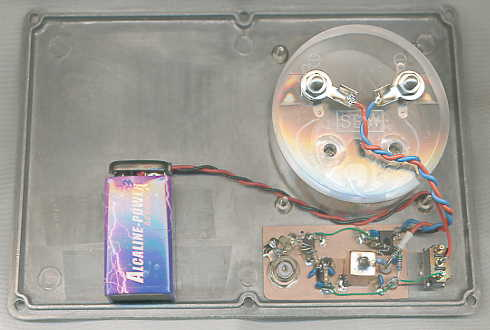
Having available a 50 uA current meter instrument (instead of the recommended 1 mA instrument), I have used 100 kOhm for the multiplier resistor R6 (replacing R6 = 6.8 kOhm in Fig. 1 of the article) to translate a range from -80dBm to +20 dBm into a displayed value of 0 to 50 uA. As seen in the inside picture, I twisted the wires connected to this sensitive instrument to suppress noise. The AD8307 will fade out at low signals of about -75 dBm and its maximum input power is +16 dBm.
A test showed that this instrument is usable with very good results in the range -70 dBm (0.1 nW) to +16 dBm (40 mW).
The input and output designators of the voltage regulator, U2 = 78L05, in the published circuit (Fig. 1 of the article) are not shown correctly (they are reversed). The input pin of U2 has to be connected to R8/C7, the output pin to R3/C6.
Apart from that, the circuit used is very similar to the one published.
The gain of the noninverting amplifier is set to G = 2 to get an output signal of about 50 mV/dB which may be displayed by an external DVM or scope.
Having available a 50 uA current meter instrument (instead of the recommended 1 mA instrument), I have used 100 kOhm for the multiplier resistor R6 (replacing R6 = 6.8 kOhm in Fig. 1 of the article) to translate a range from -80dBm to +20 dBm into a displayed value of 0 to 50 uA. As seen in the inside picture, I twisted the wires connected to this sensitive instrument to suppress noise. The AD8307 will fade out at low signals of about -75 dBm and its maximum input power is +16 dBm.
A test showed that this instrument is usable with very good results in the range -70 dBm (0.1 nW) to +16 dBm (40 mW).
Test of the PM8307 with an hp 8640B Generator
A friend allowed me to test the power meter using his hp 8640B generator.
The first table shows the measured output voltage (in mV) for the power level given in dBm at the input of the power meter. The frequency has been 10 MHz during this test. The third column of the table shows the value read from the internal 50 uA-instrument (Model MR-65P from Shinohara Electrical Inst. Works Ltd., Japan)
The last two columns are related to a linear regression -- a "best-fit" line which has been calculated using measured points from -70dBm to 13 dBm.
The last column clearly shows that this line (according to eq.(1) below the graphic) is a good approximation which may be used in some PM8307 --> A/D-converter --> microprocessor setup. V_OUT from the second column of the table is used in eq.(1) to calculate the values in column four.
| Level P_IN/dBm | Output V_OUT/mV | Current Display/uA | Calculated Level/dBm according eq.(1) | Difference "Calculated - Actual Level"/dBm |
|---|---|---|---|---|
| -90 | 414 | 4 | (-76.952) | (13.048) |
| -80 | 469 | 4.5 | (-75.855) | (4.145) |
| -70 | 772 | 7.5 | -69.813 | 0.187 |
| -60 | 1268 | 12.2 | -59.921 | 0.079 |
| -50 | 1759 | 17.0 | -50.130 | -0.13 |
| -40 | 2264 | 22.0 | -40.059 | -0.059 |
| -30 | 2770 | 26.5 | -29.969 | 0.031 |
| -20 | 3260 | 31.5 | -20.197 | -0.197 |
| -10 | 3756 | 36.2 | -10.305 | -0.305 |
| 0 | 4280 | 41.5 | 0.14376 | 0.14376 |
| 10 | 4781 | 46 | 10.135 | 0.135 |
| 13 | 4930 | 47.5 | 13.106 | 0.106 |
| 16 | 5073 | 48.5 | 15.958 | -0.042 |
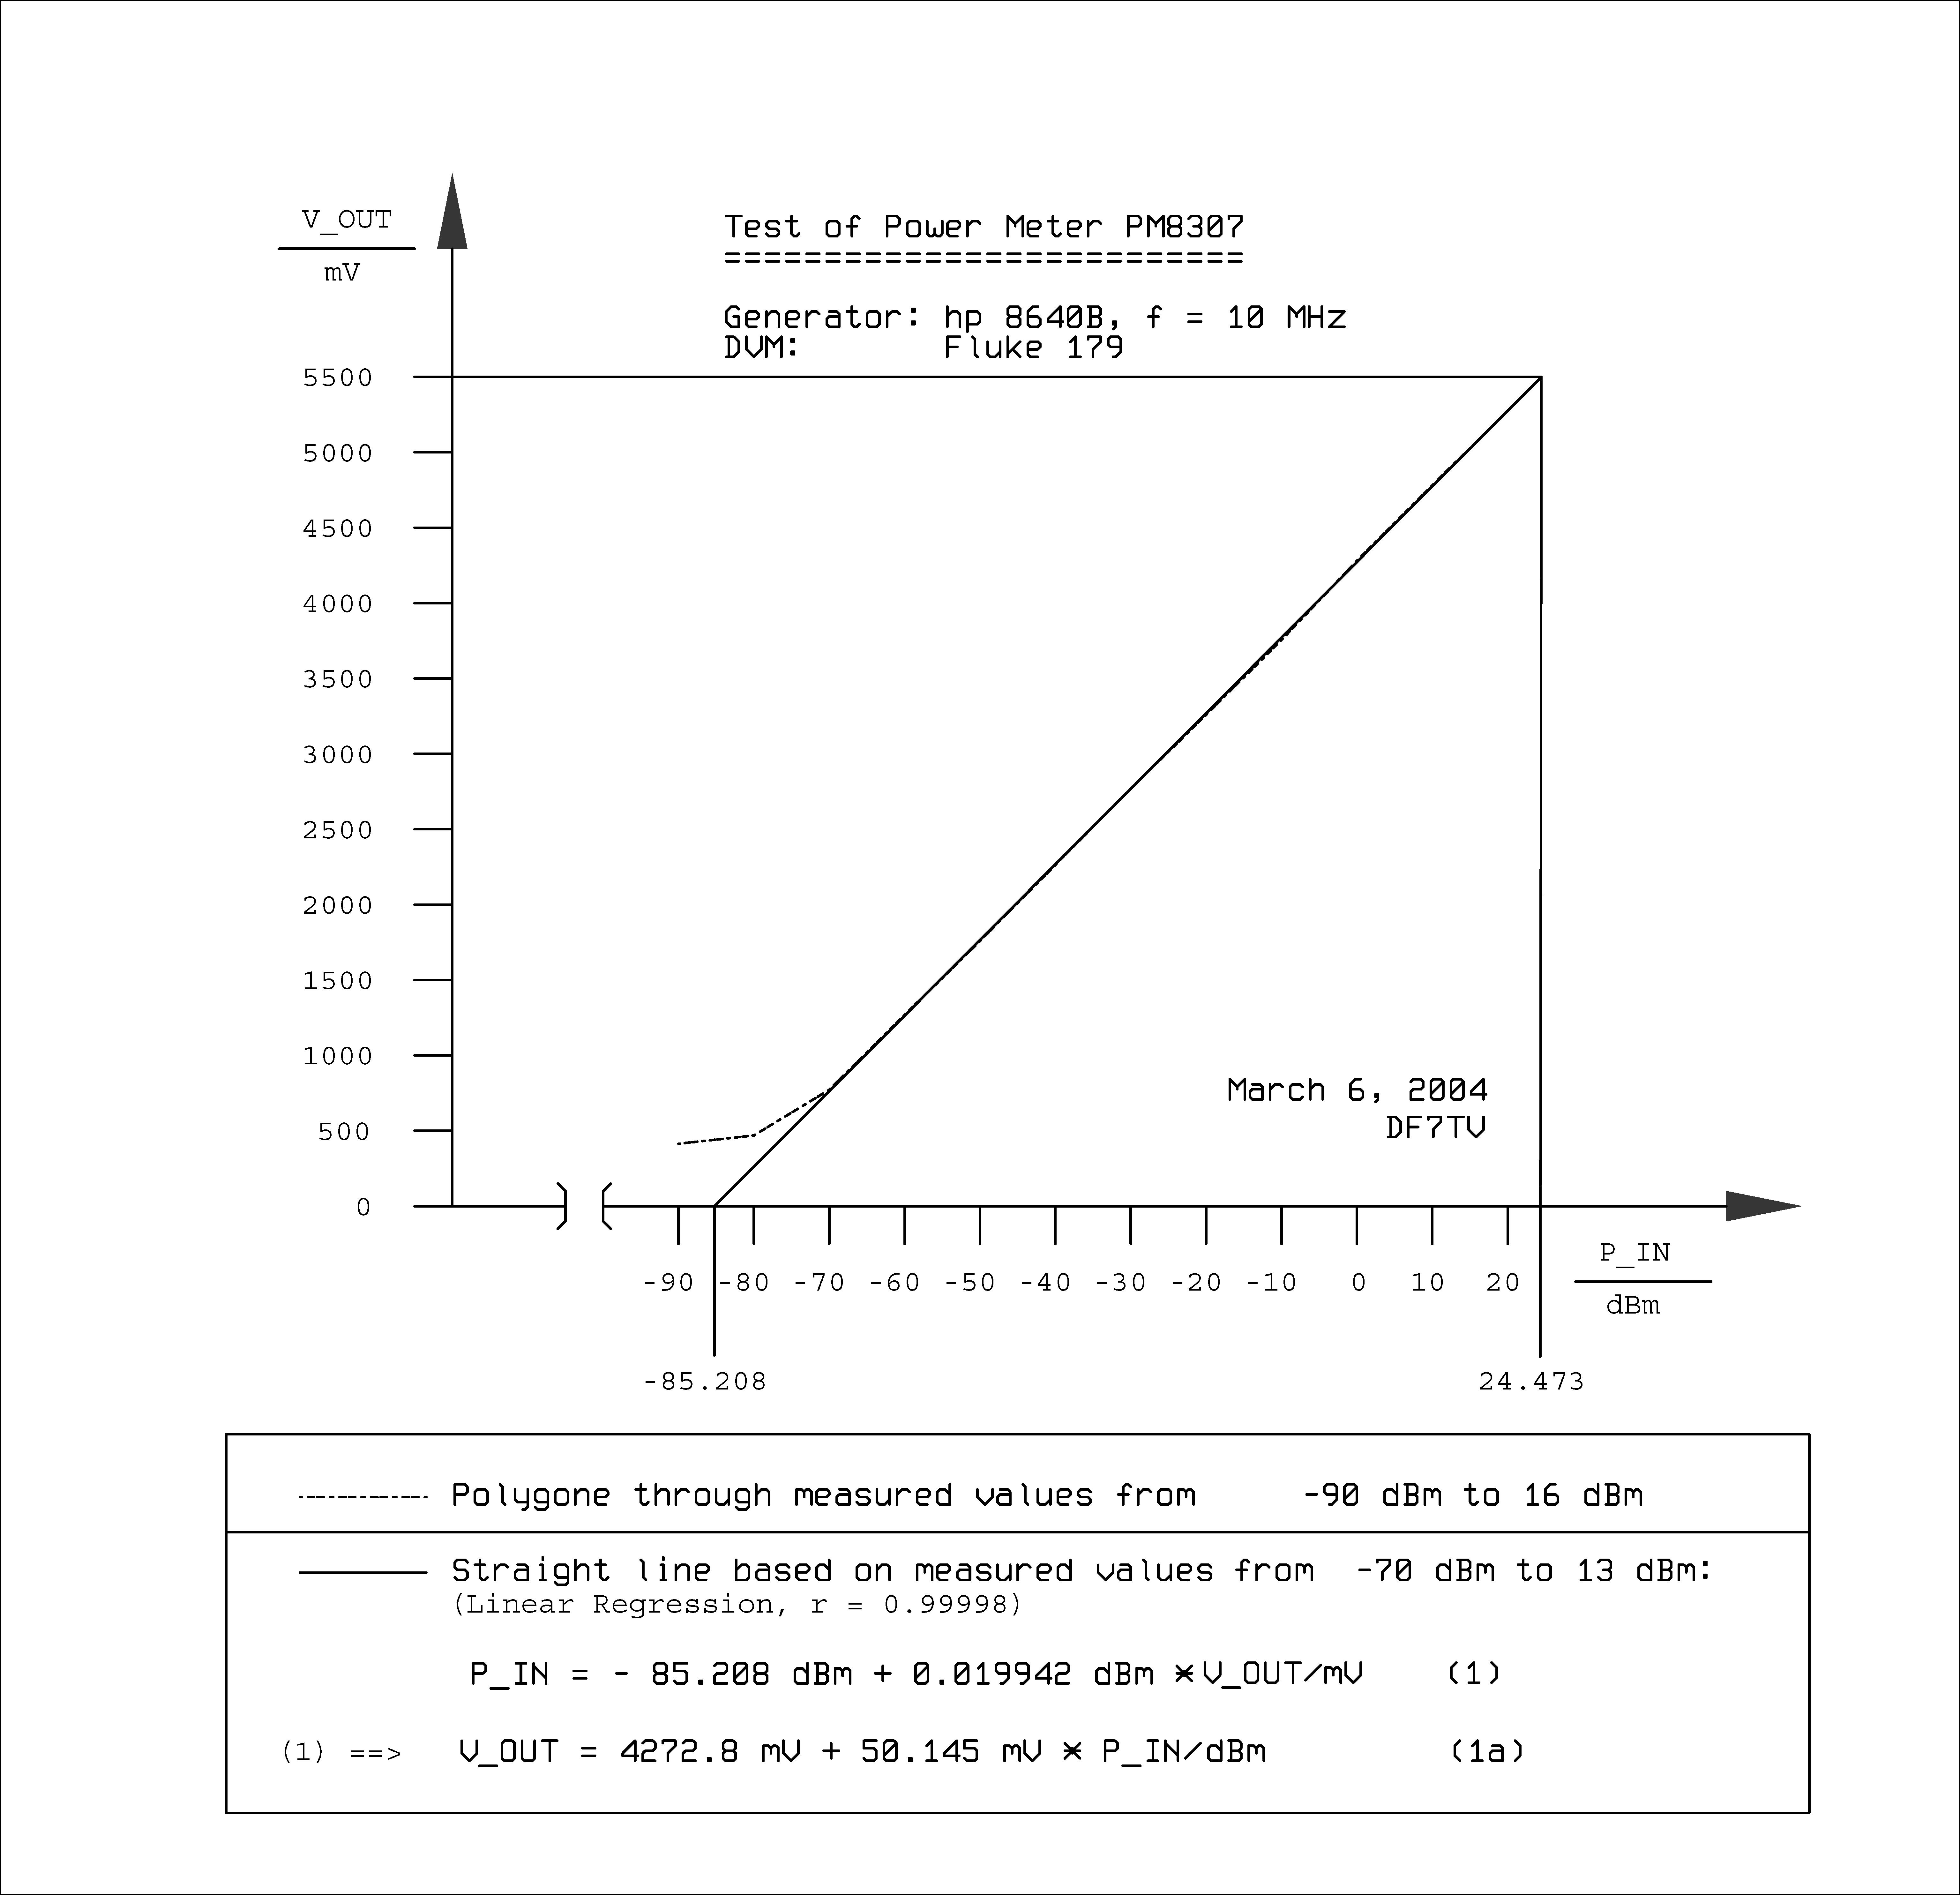
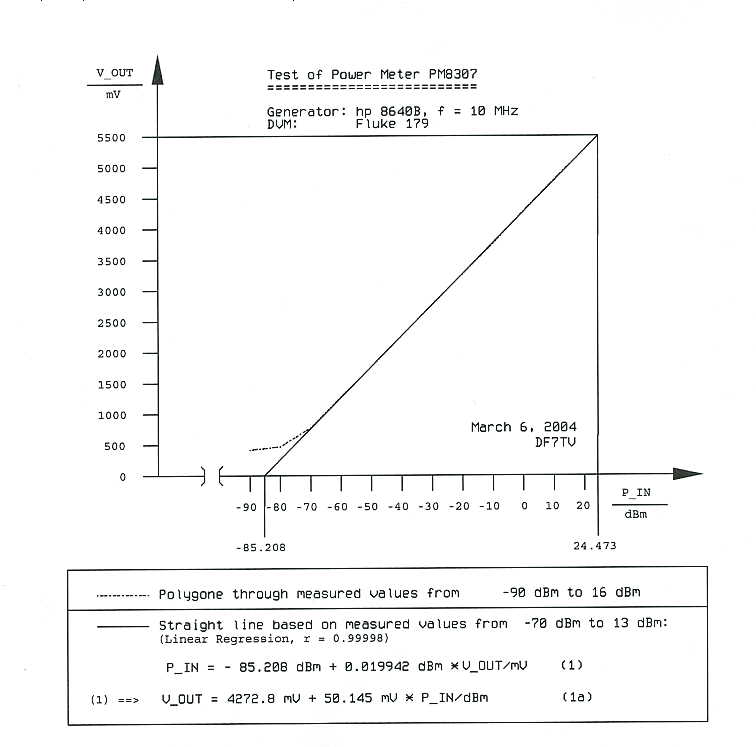
The graphic shows the data of the first table. A straight line has been
established using linear regression for the measured values from -70 dBm
to 13 dBm (...well my Casio pocket calculator fx-5500LA did it for me).
The correlation coefficient r, which describes the exactness of a linear dependance,
was found to be r = 0.99998. The correlation coefficient, in general,
may range from -1 to +1. The value +1 represents an exact linear dependance.
Yes -- both curves -- the measured one (from - 90 dBm to 16 dBm) and the calculated best-fit line are drawn, even so you can't see them separately within the linear region because the good fit of the linear regression. To have a closer look, the graphic is made available for download as a high resolution PNG bitmap-file DF7TV-pm8307-test-high-res.png.
Equations describing the best-fit line are given below the graphic and may become useful in later applications. You may observe the fading out of the AD8307 at low power levels as the curve shows a S-shape. To not destroy the AD8307 during the measurements, the input power has been limited to a maximum of 16 dBm.
t
Yes -- both curves -- the measured one (from - 90 dBm to 16 dBm) and the calculated best-fit line are drawn, even so you can't see them separately within the linear region because the good fit of the linear regression. To have a closer look, the graphic is made available for download as a high resolution PNG bitmap-file DF7TV-pm8307-test-high-res.png.
Equations describing the best-fit line are given below the graphic and may become useful in later applications. You may observe the fading out of the AD8307 at low power levels as the curve shows a S-shape. To not destroy the AD8307 during the measurements, the input power has been limited to a maximum of 16 dBm.
Wow! the calculated slope is very, very close to 50 mV/dB.
That's the value, that I had assumed during the measurement of a
filter curve before I could do this test. For input power
levels in between -70 dBm and 16 dBm the measured curve
is very close to the straight best-fit line.
The second table shows a wideband test. Power level used here
has been -20 dBm for all frequencies ranging from 625 kHz to 320 MHz and
again the output voltage is given in mV.
| Frequency/MHz | Output/mV |
|---|---|
| 0.625 | 3257 |
| 1.25 | 3256 |
| 2.5 | 3261 |
| 5 | 3259 |
| 10 | 3260 |
| 20 | 3264 |
| 40 | 3266 |
| 80 | 3237 |
| 160 | 3187 |
| 320 | 3093 |
So, regarding the 0.625 to 40 MHz range,
we got a deviation of less than +/-10 mV (or abt. +/-0.2 dBm),
if the output voltage at 10 MHz is taken as a reference.
Reference:
[1] Hayward, Wes, W7ZOI. "Simple RF-Power Measurement." QST Magazine (ARRL). June 2001, pp. 38–43.