 Fig.1
Fig.1(click on picture to enlarge)
Introduction
About once a day short bursts of gamma rays flashed at random positions on the sky.
The duration lasts from some milliseconds to several minutes.
For this short period of time they often out shined all other sources of gamma rays added together.
These flashes are called Gamma Ray Bursts (GRBs) and were incidentally first observed 1967 by satellites launched intended to look for violations of the Nuclear Test Ban Treaty.
The list of proposed sources shrunk into two main classes: very massive collapsing stars and binary star systems composed of neutron stars or black holes.
GRBs cannot be observed from the ground directly because the Earth's atmosphere absorbs gamma rays.
The Ionosphere
X-rays and short ultraviolet radiation (UV) from the Sun are able to ionize air molecules in the upper atmosphere forming what is called the "Ionosphere".
The free electrons from ionized molecules are responsible for the fact that radio transmissions of short and long wavelengths (approx. 10m to many km) can be received over wide distances far beyond horizon.
The ionosphere is been composed of layers of higher and lower concentration of free electrons called the F-, E- and D-layer.
According to these definitions we found the F-Layer at heights of approx. 150 to 1000 km mainly resonsible for short wave radio propagation and the E-layer between 100 and 130 km.
The lowest layer of the ionosphere is the D-layer at heights of approx. 60 to 90 km. In contrast to the other this layer has attenuating effects especially on long and medium wave radio propagation and it disappears at nights. Because these radio waves (10KHz < f < approx. 1MHz) are reflected mainly by the E-layer their field strengths will reach a maximum in the darkness. After sunrise when ionization effects of solar x-ray and UV become stronger the attenuating D-layer overwhelms the reflecting characteristic of the E-layer. Therefore long and medium waves coming in from long distances are damped and ground wave propagation predominates.
As mentioned before the D-layer has attenuating characteristics. The radio signals cause the free electrons in the layer to vibrate. As they vibrate the electrons collide with molecules, and at each collision there is a small loss of energy. So the attenuation effect depends on the density of the atmosphere. Shorter waves are more able to penetrate the D-layer since they cause smaller collision rates at lower heights.
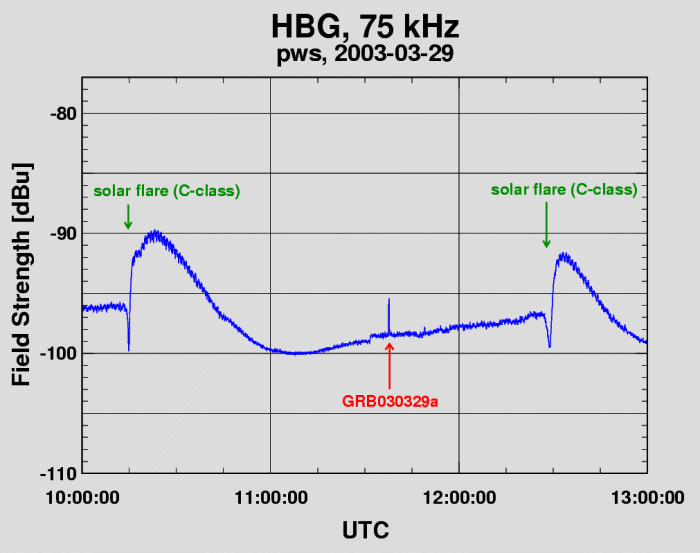
Another effect of importance for the D-layer is that only very hard x-rays and UV are able to ionizate the air molecules at heights below 100 km. UV rays (approx. 122 nm) can penetrate deep enaugh to ionizate NO molecules which exists mainly at heights of 60 to 90 km. This is due to the fact that at wavelengths of about 122 nm the atmosphere has a spectral window. In contrast to the UV radiation from the Sun the x-ray flux is not such constant. Sometimes the Sun emits bursts of x-ray called "solar flares". They lasts from some minutes to hours causing what is called "SIDs" (Sudden Ionospheric Disturbances). SIDs are disturbances of the meta stable layer structures of the Ionosphere such that high frequency propagation fade out whilst long wave propagation may improve. This is also called the "Mögel-Dellinger-Effect". The effects of solar flares are shown at Fig.1.
Fig.1
(click on picture to enlarge)
Fig. 1 exhibits a recording of the field strength of the swiss time service transmitter HBG at 75 KHz.
Method
The ionosphere can be used as a sensitive indicator for any ionizing radiation coming from space.
This can be done by observing the reflected waves from a stable and reliable radio transmitter at LF or VLF over long periods of time.
Normally the received signal from a distant source of LF/VLF radiation is a mix from sky wave and ground wave propagation.
Sky waves are coming in from above at various elevation and phase angles.
Ground waves in contrast are mostly constant in amplitude, phase and elevation angle (0°).
Therefore it's easy to filter out this unwanted signal by means of directive antennas like magnetic loops or ferrite rods.
At LF propagation pathes running South<->North show somewhat "cleaner" observing results at my location than pathes running East<->West.
HBG is a time service station (75 kHz, 20 kW, Prangins/Switzerland, 46°24'N - 06°15'E) bearing approx. 192° at 920 km from here near Kiel, North Germany (54°16'N - 10°04'E).
Materials
The receiving equipment was first setup in 1999 on the occasion of a solar eclipse.
Results can be viewed >here< .
At that time the antenna was located near the main building.
Antenna:
The antenna system consists of a 30cm ferrite rod shielded from the E-field vector by an elaborate copper environment.
It has been tuned to 75 KHz by high grade capacitors selected for thermal stability.
A two stage amplifier (BF245b in front, approx. 20dB of gain) raised the signal up to levels where local noise sources could have minor influences only.
This amplifier has been mounted inside the copper shield.
The whole antenna system is located now inside a wooden hutch and fed through 25m of buried coax cable.
Receiver:
The amplified signal is fed to a commercial selective level meter (Präcitronic. MV61) running at 100 Hz of bandwith.
A phase locked loop locks the frequency of the main local oscillator to approx. +-10 Hz under all circumstances.
The MV61 has a calibrated DC output channel (-0.5 to 2 Volts, logarithmic).
Analog-Digital Conversion and Storage:
The carrier of HBG is switched on and off for 100 or 200ms (binary "0" or "1") each second coding the date/time.
Assuming a sampling rate of 1 sec. there's a chance of 10% or 20% hitting one of these transmission gaps.
This looks very bad on the recording traces.
Therefore I'm running a simple RC-integrator in front of a digital multimeter (METEX, M-3630d).
The time constant is approx. 2.6 sec.
This time constant is not able to smooth out the transmission gaps fully if hit by the ADC.
A simple home made program running on a LINUX-Pentium computer controls the DMM over a serial line.
It handles all communication, storage of data, time stamps and the sampling rate of 1 per sec.
Data files (approx. 2.3 MB per day) are backed up to a HP NetServer on a daily base.
Display:
Online graphical display is performed by Gnuplot.
The traces shown here were made with Xmgrace and The Gimp.
You can see more notes and pictures of my amateur radio station setup >here< .
Data Processing and Results
In Fig. 1 around 11:40 UTC an unusual sharp peak can be observed.
At that time the Earth was hit by one of the strongest Gammaray-bursts ever detected (GRB030329a).
The source has been located by satellites above the back of the star constellation called "Leo".
At that time this sky position was approx. 10° below horizon here near Kiel at ground level.
But the source of gamma rays was above horizon around 100 km of height where the reflecting E-layer has been located.
Therefore the attenuating D-layer was not affected by the GRB.
This height of horizon was determined by the equation:
H = (R/cos(a))-R
where
a: angle below horizon at ground,
R: radius of Earth
The position of the GRB compared to horizon was estimated by Xephem 3.5.2 for UNIX workstations.
Fig.2 shows this sharp peak enlarged in detail.
Checking the real time clock of the computer against the official time an error of +4 sec. was found.
Therefore all data points shown here are corrected by -4 sec.!
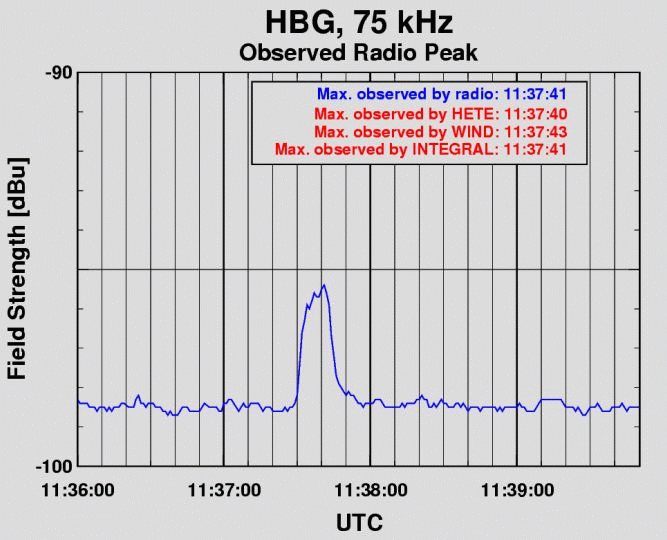 Fig.2
Fig.2
(click on picture to enlarge)
Next the light curves of GRB030329a from three satellites
were downloaded from their sites. The following GRB030329a trigger dates has been extracted from these graphics: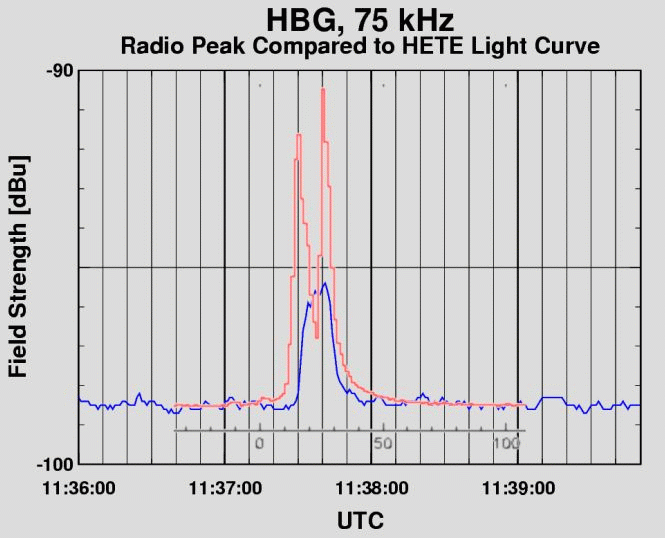 Fig.3a (click on picture to enlarge) |
 Fig.3b (click on picture to enlarge) |
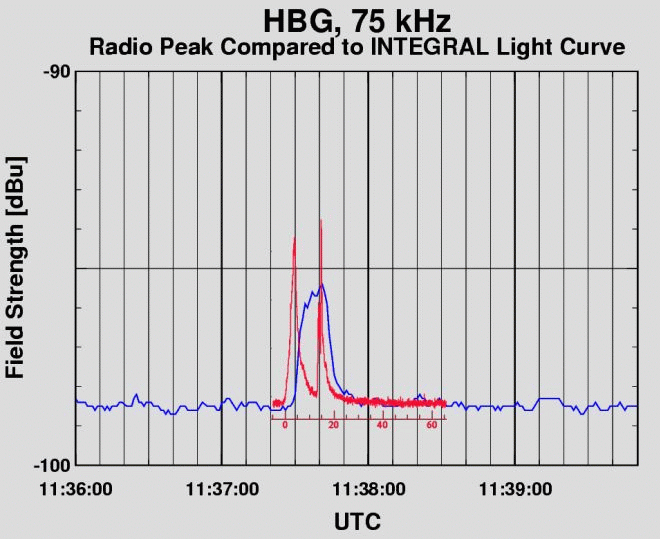 Fig.3c (click on picture to enlarge) |
The y-axis scalings are useless of course since the satellites instrument traces are presented on linear scales (counts) and the radio recordings on a logarithmic (dB).
Fig.4 shows the recording of the whole day added by some notes on what can be viewed.
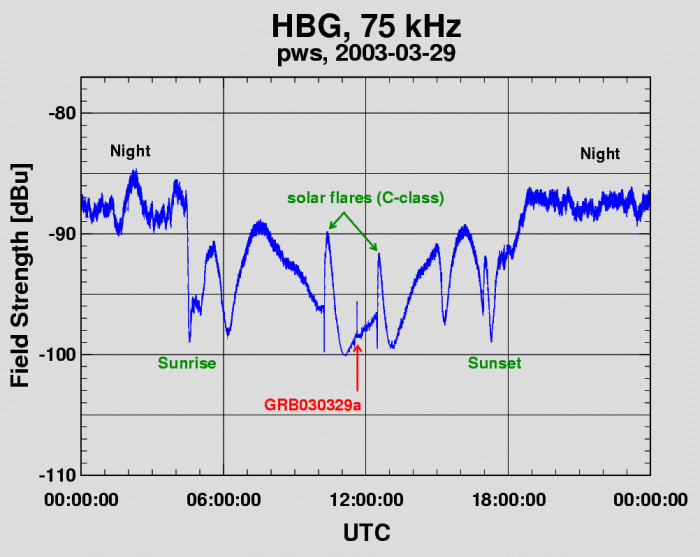 Fig.4
Fig.4
(click on picture to enlarge)
Discussion
I'm not a physicist and furthermore not an astrophysicist. I'm an experienced radio amateur only.
Therefore it is not reasonable here to interpret the results in depth.
The pros:
Many thanks to: